Back in 2021, readers Toyo Keizai were shocked when I wrote a piece entitled Japan as 196th . It showed that, out of 196 countries tracked by UNCTAD (United Nations Conference on Trade and Development) in 2019, Japan came in 196th when it came to the cumulative stock of inward Foreign Direct Investment as a percentage of GDP. FDI occurs when a foreign company either creates its own operations on Japanese soil or buys at least 10% of an existing Japanese company.
Nonetheless, despite all the progress claimed by Japan, as of 2023, UNCTAD reports that Japan is still 196th. The stock of FDI stood at 5.9% of GDP. While that was up from 4.4% in 2019, Japan was chasing a moving target. So, like someone on a treadmill, Japan had to run fast just to stay in place.
Impossible Dream
Now, Japan promises to run even faster on that treadmill. In 2021, it projected cumulative inward FDI to reach ¥80 trillion by 2030. In 2023, it raised the 2030 target to ¥100 trillion. And now, as if at an auction, the Ishiba administration is considering an even higher target to ¥120 trillion.
The latter would equal 17% of nominal GDP if the IMF’s forecast for 2030 GDP is correct. While 17% in 2023 would have put Japan at 175th among 199 nations, that is still a long way from the 1.0% level in 2000 and 6% in 2023. And yet, it’s still very far from the 35% of GDP that scholars Takeo Hoshi and Kozo Kiyota calculated that Japan could have reached a decade ago if Japan performed like other rich countries.
But is ¥120 trillion, or even ¥100 trillion at all realistic? Or is it like so many other lofty goals set by the government that have little basis in reality? ¥120 trillion by 2030 would require six straight years of 14% annual growth. Japan has never before even come close to that.
Why Should We Care?
Decades ago, economists discovered that countries with more inward (and outward) FDI grow faster. A study of 19 OECD countries confirmed that FDI improved growth mainly by raising productivity.
Even the little inward FDI that Japan has done shows what Japan is missing by not having more. Compare, for example, the impact on Japanese companies when a foreign company bought a domestic manufacturer (a mere 67 cases during 1994–2001) versus an acquisition by another domestic firm (1,362 cases).
The ones purchased by foreigners showed twice as big an improvement in Total Factor Productivity (TFP), i.e., productivity of both labor and capital. The greater the share of foreign ownership in a firm, the higher that firm’s spending on R&D, the number of patents generated, sales growth, exports, profitability (return on assets), and productivity.
What’s really important is that, when foreign-owned firms in Japan conduct R&D, they generate seven times as much spillover productivity benefits at other firms (suppliers, customers, even competitors) than do domestic firms spending the same amount. One scholar concluded that this is “probably because knowledge of foreign firms is often new to domestic firms.”
Bending the Rules To Inflate The Numbers
One of the problems in analyzing inward FDI is that the Ministry of Finance (MOF) flouts international rules of FDI accounting to inflate Japan’s numbers.
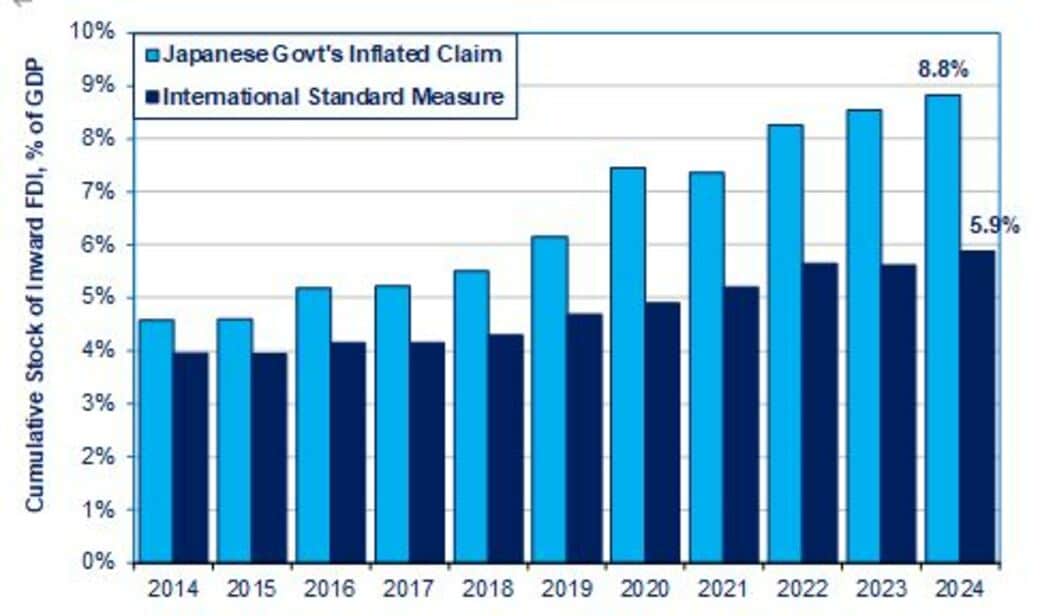
As a result. the MOF claims that, in 2024, Japan’s cumulative stock of inward FDI added up to ¥54 trillion, or 8.8% of nominal GDP. In reality, according to the accounting rules laid down by the IMF and OECD, and shown by UNCTAD on its website, the stock was just ¥36 trillion, i.e., 5.9% of GDP (see chart below).
What accounts for the difference? The MOF counts as part of FDI something that the IMF and OECD say should defintely not be counted: loans to Japanese parent companies from their own affiliates overseas. These loans are counted when one is looking at financial flows in the balance of payments, but an OECD spokesman was very clear that they should not be counted when one is comparing a nation’s FDI over time or in comparison with other countries.
Genuine FDI means investments in Japan by foreign companies, not intra-company loans. The only items that should be counted are new money (equity) invested in Japan or reinvested profits from existing affiliates of foreign companies. Over time, intra-company loans within Japanese companies became an increasingly large share of alleged inward FDI as counted by the MOF: from ¥3.2 trillion in 2014 to ¥18 trillion by 2024. In fact, about half of the entire alleged growth in FDI from 2014 to 2024 came from such illegitimately counted loans.
Weaker Yen Creates Statistical Illusion
There is a second factor that has made the growth in FDI appear larger than it really has been, when it is measured in yen. In this case, there is no playing with numbers by the MOF here. Instead, it’s a statistical illusion created by the big depreciation of the yen. Investors have to change their dollars, euros, etc. into yen in order to invest. UNCTAD, the IMF, etc., measure the dollars invested.
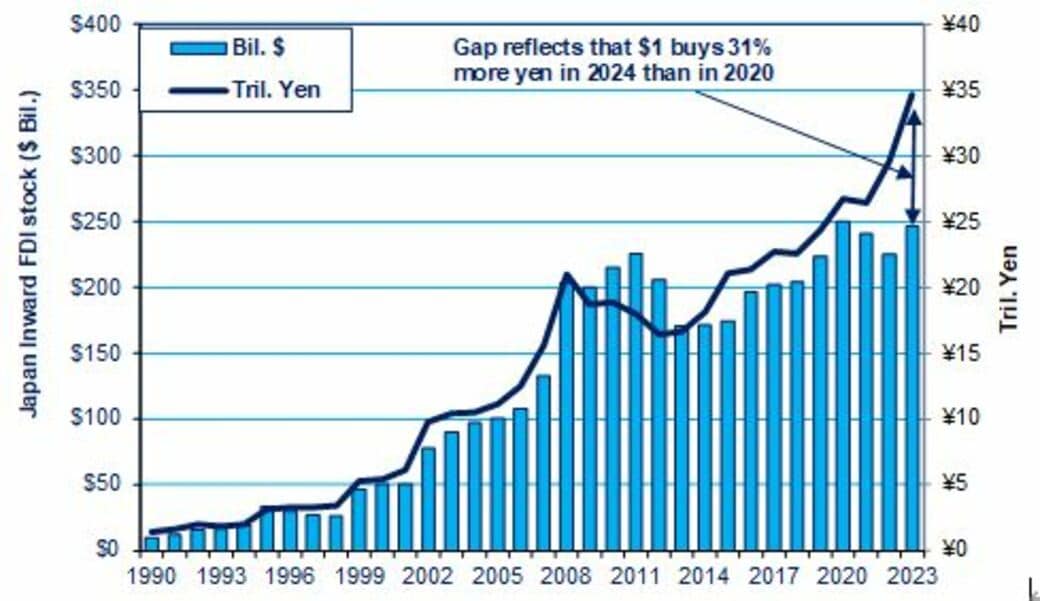
When the yen is weakening, this distorts the apparent growth when measured in yen. From 2020 to 2023, UNCTAD figures show that the stock of inward FDI actually fell slightly (about 1%) from $250 billion to $247 billion. However, due to the depreciation of the yen during that period from ¥107 per dollar to ¥141, each dollar coming in bought 31% more yen in 2024 than it had in 2024. Hence, in yen terms, the stock of inward FDI appeared to rise from ¥27 trillion to ¥35 trillion. We can see the impact in the chart below when we see the emerging big gap in the last few years between the line (showing FDI in yen) and the columns (showing FDI in dollars).
What would the picture have looked like if the yen had not been deliberately weakened under the policies of Abenomics from 2014 through 2024? In 2014, inward FDI, as measured properly under the international rules, equaled 4% of Japanese nominal GDP. Due to the yen’s depreciation, inward FDI appeared to rise to 5.9% of GDP. Suppose, however, that the yen had not depreciated. Then the amount of dollars coming in would have translated into yen terms to just 4.4% of GDP, not 5.9%. That’s not much above the 4% figure for 2014.
What will happen if the yen recovers some of its past value? In that case, the opposite impact will occur. Dollars coming in will translate into fewer yen and, when measured in yen, FDI’s share of GDP will not grow as much. If the yen strengthens enough, inward FDI could even fall when measured, even if it is still growing in dollar terms.
Tokyo’s “Action Plan” Leaves Out the Most Important Factor In Making Japan 196th
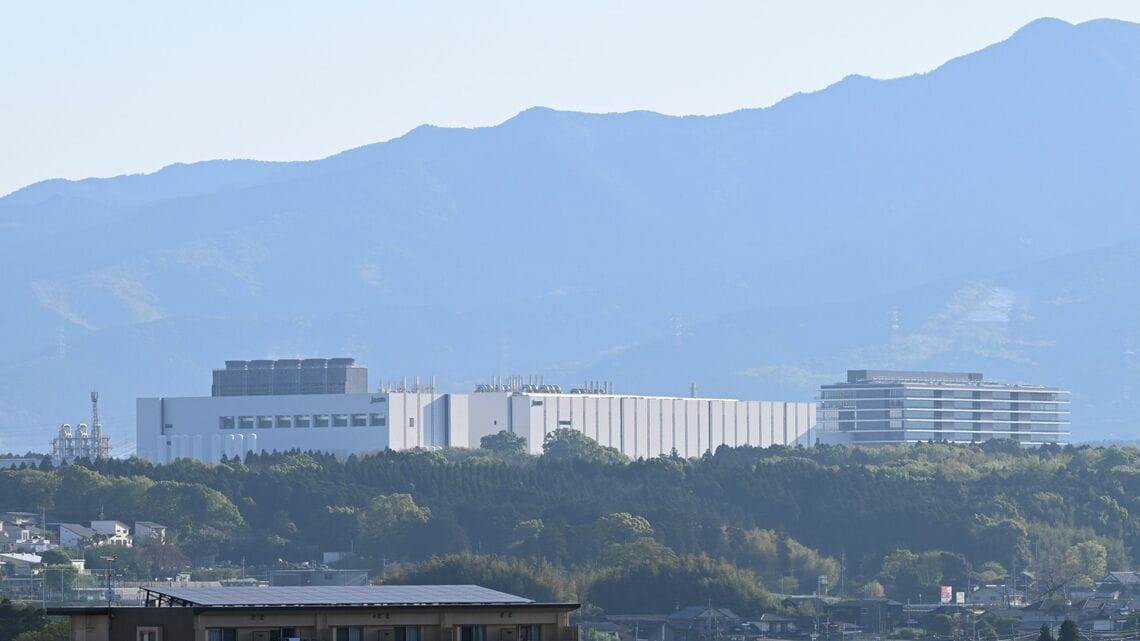
In 2023, the government issued its latest “action plan” on attracting more inward FDI. Like its predecessors, it omits the most crucial factor: most companies foreigners want to buy are not for sale. When Tokyo thinks of inward FDI, it primarily desires foreign companies setting up new operations in Japan, like TSMC’s semiconductor plant in Kumamoto. However, in rich countries, over 85% of inward FDI is foreign companies buying healthy domestic firms. Such acquisitions are rare in Japan.
Japan is clearly attractive to foreign businesses, due to its large, affluent market, a very well-educated workforce and customer base, and high technological capacity among potential suppliers and partners. In a 2025 “FDI Confidence Survey” of senior executives around the world, Japan ranked the fourth most attractive place to invest.
The press is filled with instances of gigantic rescue purchases, like Renault’s investment in Nissan and Foxconn’s takeover of Sharp. However, the usual Japanese target for foreign acquisition is not a company needing rescue. On the contrary, it is companies with higher profits, better technical capacity, and a greater willingness to adopt new practices than the typical firm in its industry. Foreign firms also select fairly sizeable companies. During 1996-2020, foreigners paid $112 million for non-group companies on the stock market.
Unfortunately, the most attractive targets are out of reach because they belong to corporate groups, the vertical keiretsu. Japan’s 26,000 parents and their 56,000 affiliates employ 18 million people, a third of all employees in Japan. During 1996-2020, foreigners were only able to buy a trifling 57 members of corporate groups, whereas they were able to buy around 3,000 unaffiliated companies.
By contrast, domestic buyers bought almost 40,000 companies during this period. The domestic purchases were much smaller firms needing a rescue, e.g. just ¥1.7 billion for the average listed group member that they bought, whereas foreign invetors bought much bigger and healthier firms worth ¥265 billion on average per firm.