Summer in Tokyo is Gradually Becoming Hotter and Longer
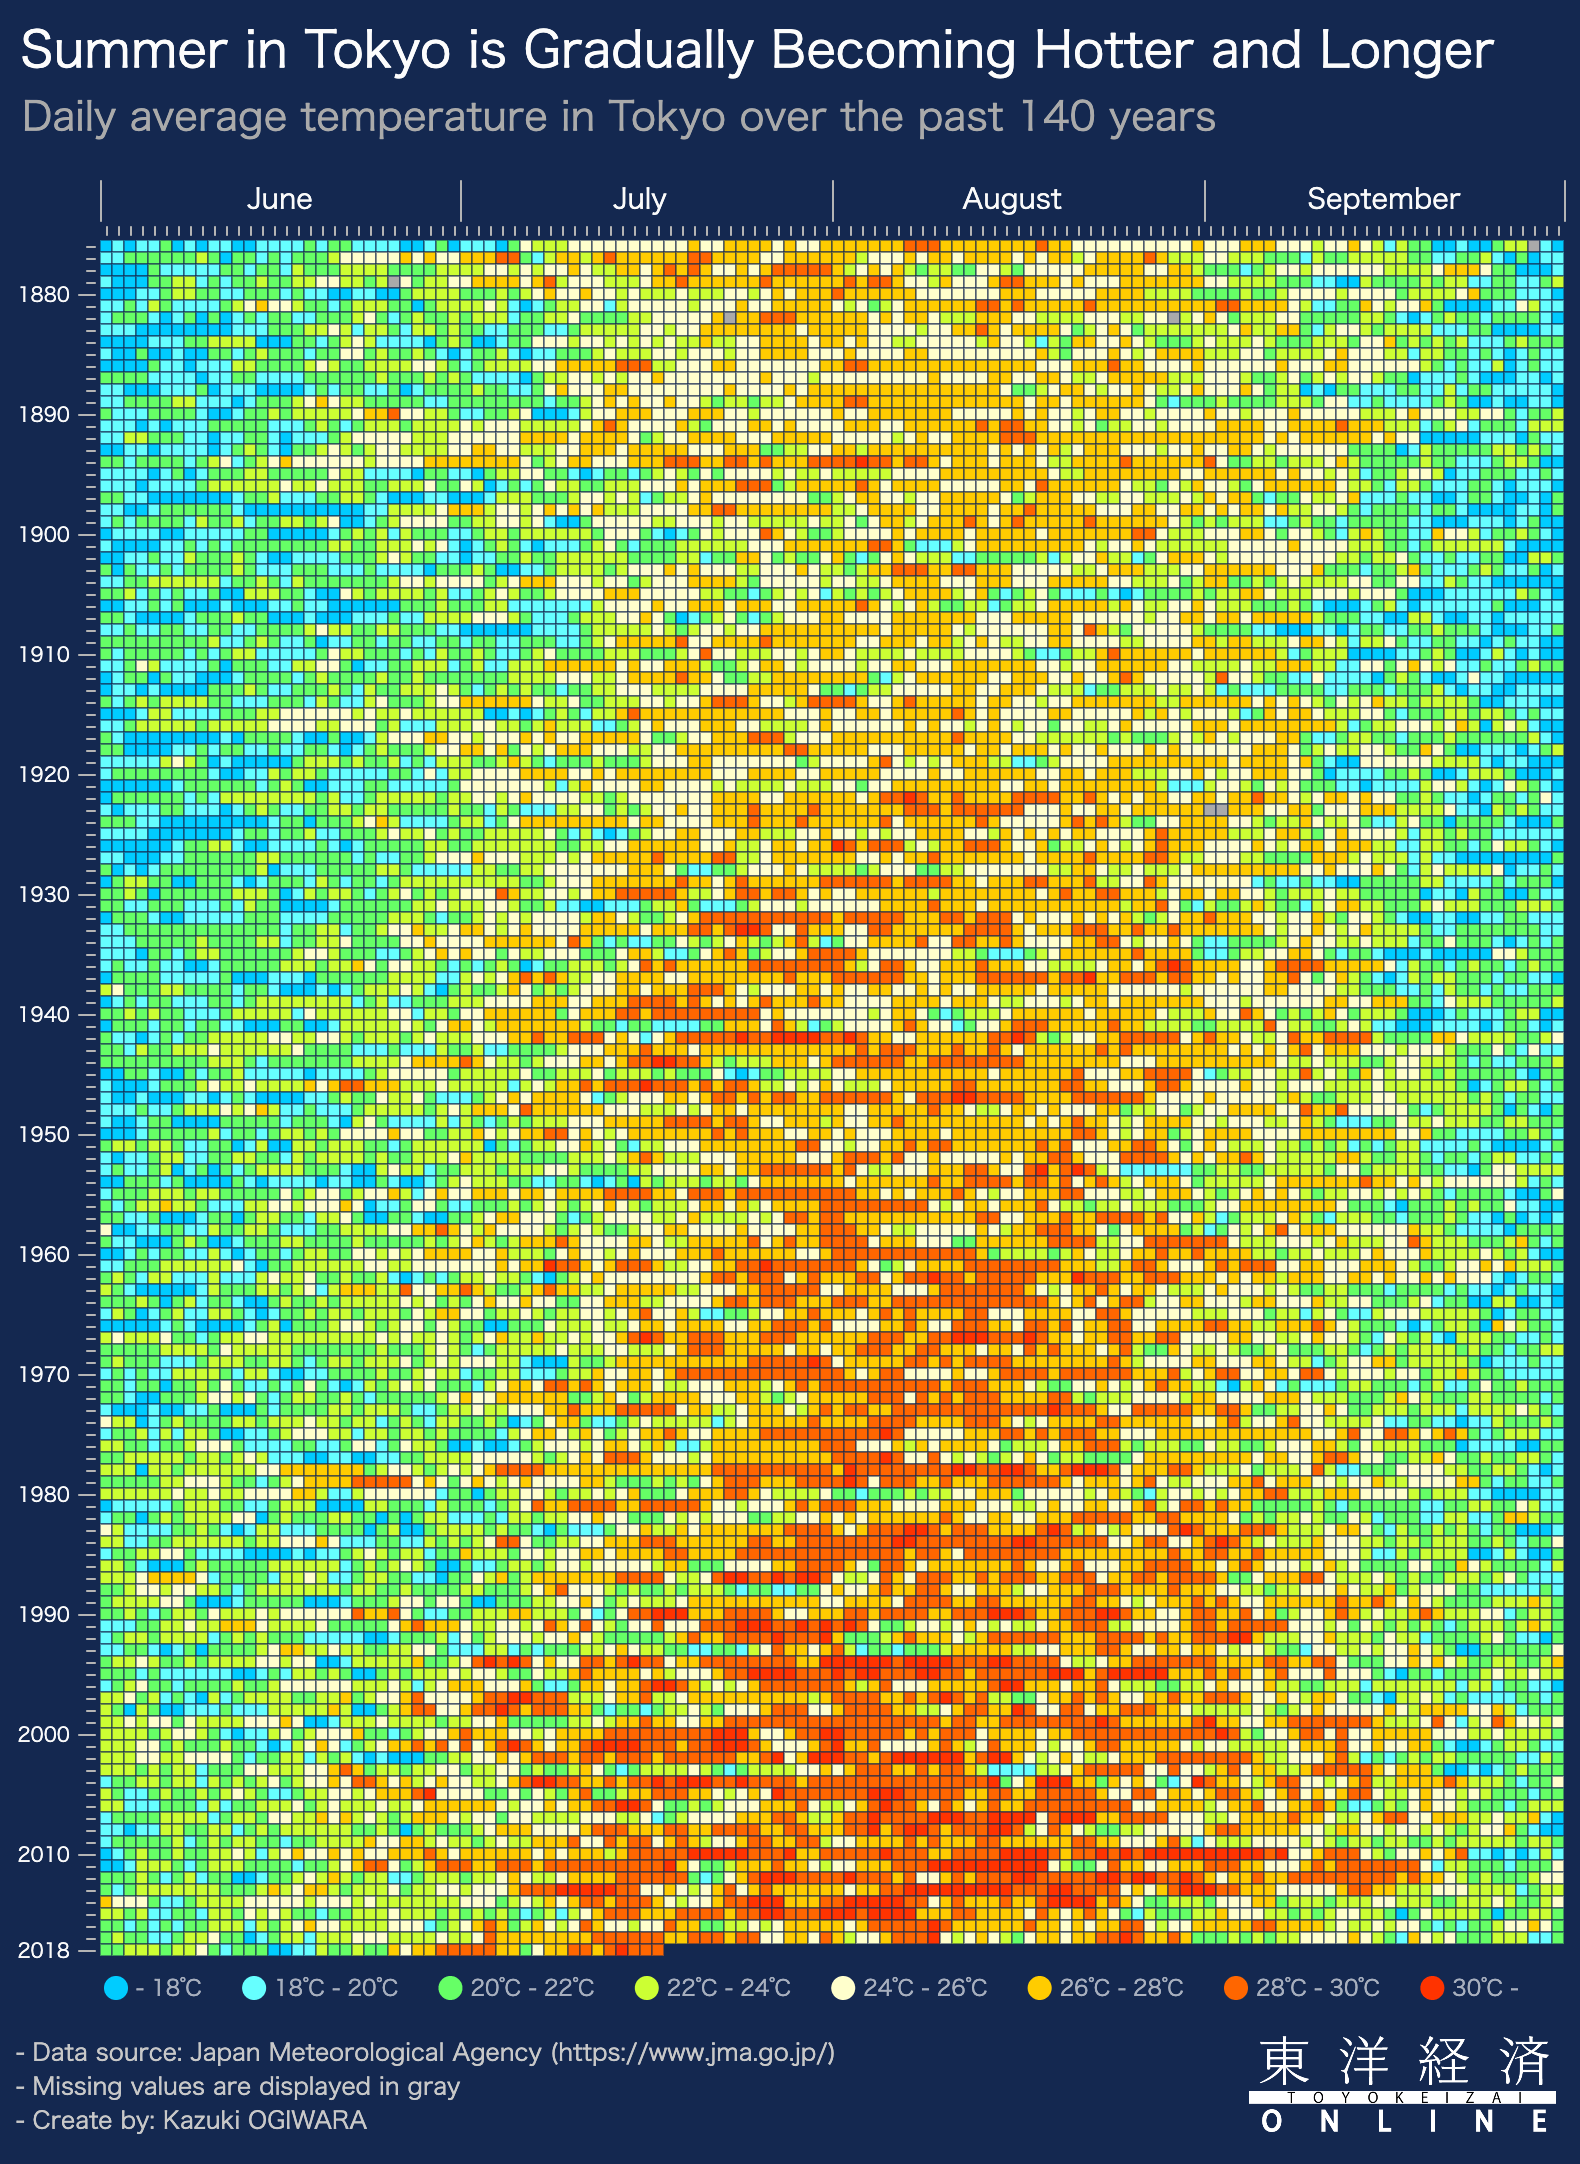
Daily average temperature in Tokyo over the past 140 years
21 July 2018
Hover over or tap on a cell to see detailed information
This heat map indicates the average daily temperatures of the summer season (June to September) in Tokyo over the course of 140 years. You can hover over or tap on a cell to see detailed information. Each cell indicates the average temperature on the day by 2°, from blue (less than 18°C) to deep red (30°C or more). The raw data were obtained from the Japan Meteorological Agency. This visualization shows that the temperature in Tokyo has been steadily rising and now approaching a deadly level.